Every day we offer FREE licensed Android apps and games you’d have to buy otherwise.
Android Giveaway of the Day - Descriptive Statistic App
This giveaway offer has expired. Descriptive Statistic App is now available on the regular basis.
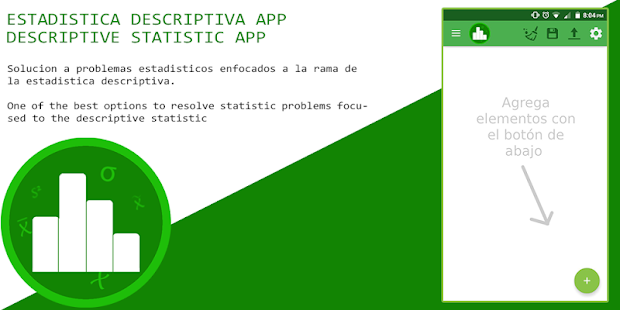
One of the best options to resolve statistic problems focused to the descriptive statistic in the probability.
FEATURES
- Nice and intuitive interface.
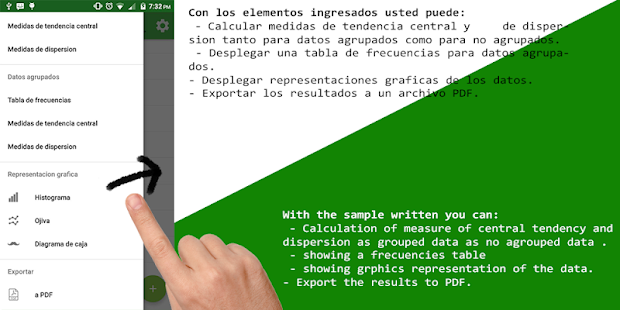
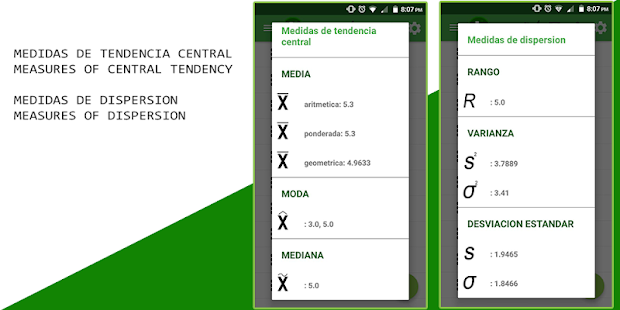
- Calculation of measure of central tendency.
- Calculation of measure of dispersion
- Frecuencies table
- Graphic representation
- Ojive
- Histogram
- Box plot
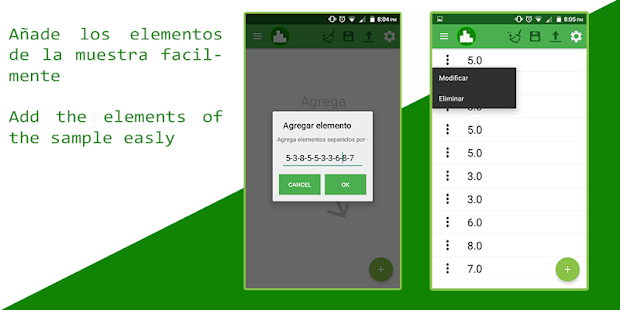
- Storage data
NICE AND INTUITIVE INTERFACE
The app has a atractive design to the see, with controls and tools easy to locate.
It was developed with the new components and the filosofy of Material Design.
CALCULATION OF MEASURE OF CENTRAL TENDENCY
It calculate with quickness the mean, median and mode of the sample given from agrouped data and no-agrouped data.
CALCULATION OF DISPERSION MEASURE.
It develops the range,standard deviation and variance, both sample and population.
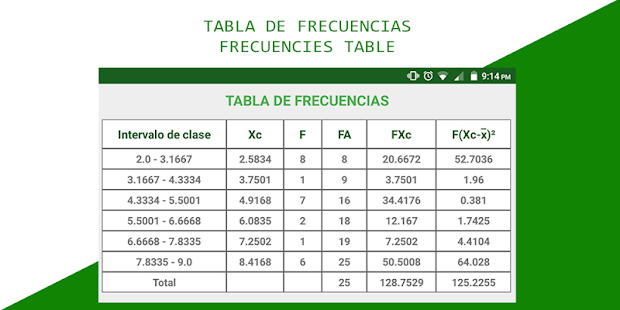
FRECUENCIES TABLE.
It makes a table with the information of the obtained data as long as the data amount
is upper 20.
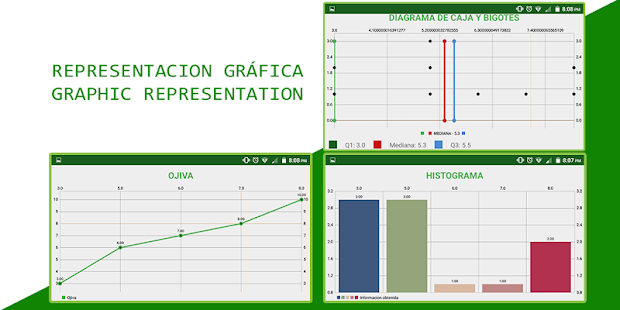
GRAPHIC REPRESENTATION.
The app contains three representation modes of data, ojive, histogram and box plot.
Everything is made automatically with a good result.
STORAGE
save, modify and delete records are a few of extra functions that this app can do.
Developer:
Valdez Projects
Category:
Education
Version:
4.0
Size:
3.0M
Rated:
Everyone
Compatibility:
4.0.3 and up

Comments on Descriptive Statistic App
Please add a comment explaining the reason behind your vote.